
Every clinic and laboratory produces reports. Far fewer stop to ask what separates a genuinely good one from an average one. "Great" can sound subjective, but in patient reporting it isn't — it comes down to a specific, checkable set of qualities that either show up in a report or don't.
This post is a summary of our full practical guide to health checkup report design — the six criteria that matter most, condensed into a quick reference you can hold up against your own reports. Use it as a working checklist, whether you are redesigning your own report template, briefing a designer, or evaluating a reporting platform for your clinic.
At LabToWellness, we've spent more than 15 years building health checkup reports for clinics, laboratories, and wellness centres — and part of our service is helping each client create the report format best suited to their patients and services. This checklist draws directly on that experience.
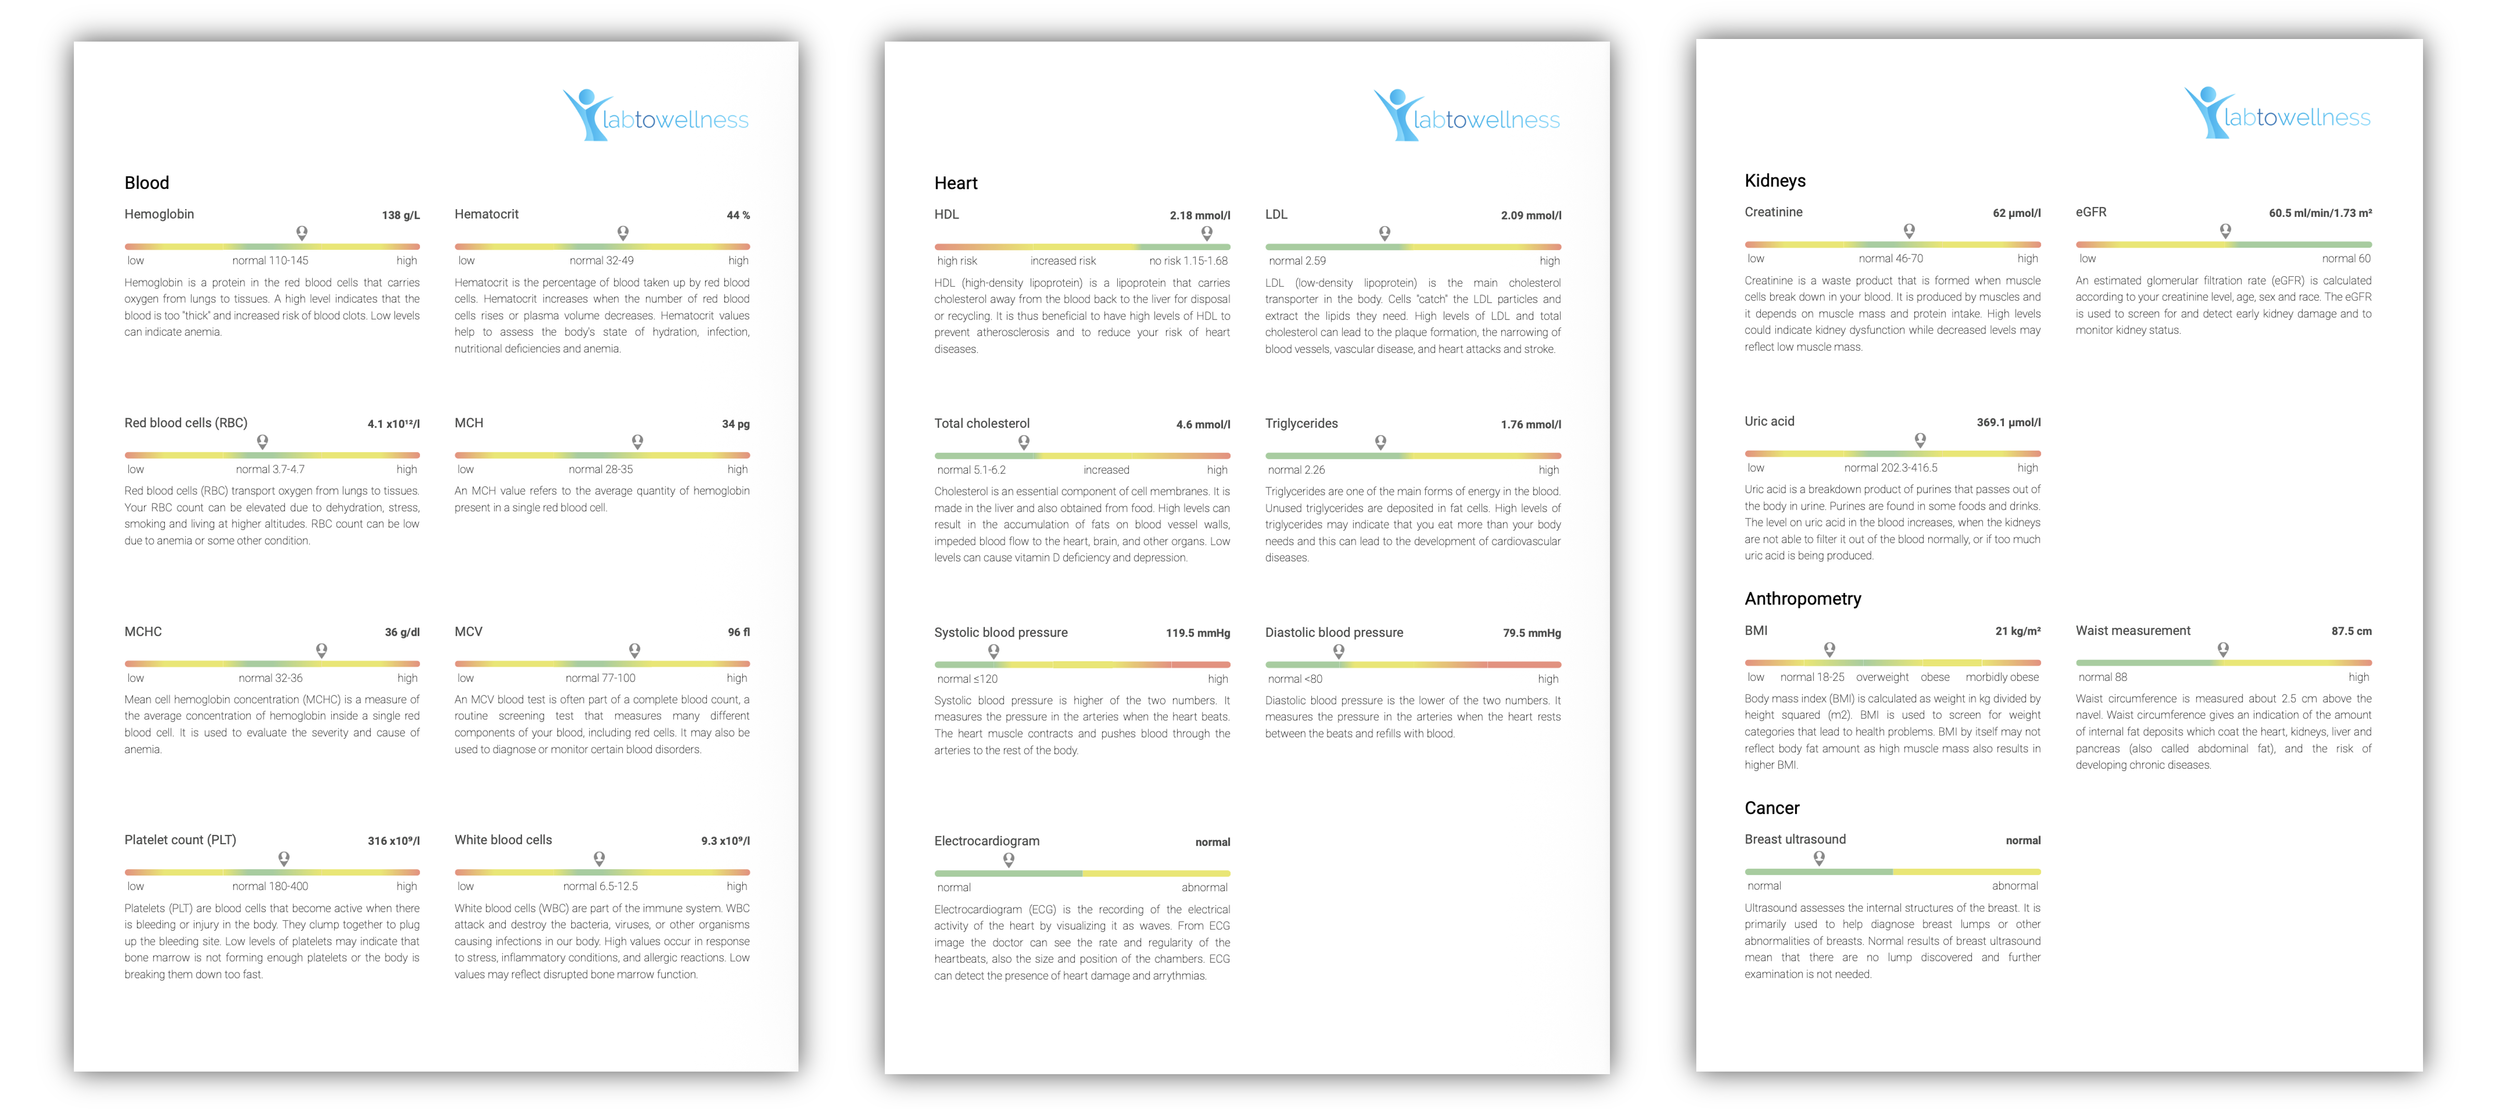
A patient should be able to glance at a page and know, immediately, whether something needs their attention. That requires a clear visual hierarchy — not just numbers in a table.
- Colour-coded status indicators (green, amber, red) used consistently throughout
- The clinically most relevant figure placed first, not buried in a list
- In-range and out-of-range results visually distinguishable without reading the reference range
A number without context is meaningless to most patients. Every result should be accompanied by a short explanation of what it measures and why it matters — written for a general reader, not a clinician.
- No unexplained abbreviations or clinical shorthand
- A one- or two-sentence explanation for each biomarker or measurement
- Context on what a result outside the reference range might mean in practical terms
Generic advice handed out like a brochure — "eat well, exercise more, see your doctor if concerned" — is routinely ignored, no matter how well intentioned. Recommendations placed inside the report itself, directly alongside the patient's actual results, are far more likely to be read, trusted, and acted on.
- Recommendations reference specific values, not just the test category
- Different results produce visibly different recommendation text
- A clear, single next step — not a paragraph of caveats
A typical health checkup report combines laboratory values, physical measurements, and questionnaire responses. Patients don't experience these as separate systems — they experience one report. When sections look like they came from different documents, it undermines confidence in the whole.
- Same colour logic and typography across lab, physical, and questionnaire sections
- Results grouped by health theme (cardiovascular, metabolic, etc.), not by data source
- One tone of voice throughout, regardless of which system the data came from
Good reports have a shape. They open with a summary, guide the reader through areas that need attention, and close with clear next steps — rather than presenting every data point with equal weight in the order it happened to be measured.
- A short executive summary or overview at the beginning of the report
- Results that need attention surfaced early, not buried on page six
- A logical flow the patient can follow without jumping around
None of the above matters if it only holds true for the reports someone had time to polish by hand. A great report format is only as good as its consistency at volume: patient number 500 should look exactly as considered as patient number one.
- No formatting drift between reports compiled by different staff members
- Branding, layout, and tone identical across every report the clinic sends
- Zero copy-paste errors, because there is no manual copying involved
Taken together, these six criteria form a simple test: hand your current report to someone outside your clinic and watch how long it takes them to understand what it's telling them, and what to do next. If the answer is more than a few seconds, there is room to improve.
How LabToWellness addresses this
LabToWellness is built around exactly this checklist. Every report our platform generates applies consistent visual hierarchy, plain-language explanations, and personalised recommendations — across laboratory results, physical measurements, and questionnaire data — without manual assembly.
A focused 20-minute call — you'll leave with a clear picture of what's possible.
Or browse example report designs first
Browse report designs →